Today is the second day of Teacher Recognition Week, and I was a little surprised that teachers had a whole week, whereas most public recognition is confined to a 24-hour span. I had thought that this was a case of mission-creep, expanding from one day to a week, and, because most teachers are public employees of some stripe, perhaps a case of Government-bloating.
Well, surprise, surprise, surprise. Teachers aren’t the only ones to have staked out a week for themselves. Over at the National Today site, one can find a truly staggering list of Appreciation Days. Whatever wildly-inflated number of such days you thought there were, you are almost certainly low. Very low. Today, 7 May, is Beaufort Scale Day, National Avery Day, National Foster Care Day, National Packaging Design Day, and Poem on Your Pillow Day. It is also the second day of Donkey Week. Given the general political inclinations of teachers, there is maybe a pithy observation somewhere in there.
Besides teachers and donkeys, other week-long May-specific recognitions are:
Youth Week 4 May to 10 May. New Zealand only.
National Correctional Officers Week First full week in May. What, not 5 to 10?
National Tourism Week 5 May to 10 May.
Pet Appreciation Week 5 May to 11 May
Public Service Recognition Week 5 May to 11 May
National Salvation Army Week 13 May – 19 May. Originally observed 28 November to 4 December.
National Police Week 15 May – 21 May
International Coaching Week 17 May – 23 May
Public Works Week 19 May – 25 May
British Tomato Fortnight 20 May – 2 June. A period of two weeks, but more than a day, less than a month.
And that is just May. For spins and giggles, I looked at my birthday. It includes National Baker Day, Redhead Appreciation Day, and World Reflexology Week. I notice that the day prior is International Day of Radiant Peace, and the day after is Bluebird of Happiness Day. What the hell? I feel like I was born on a rather inauspicious day, a sort of Valley of the Shadow kind of thing. Well, I can claim the First Day of Autumn. Some years.
Random Images

The second reason people don’t like sports car owners. The first, of course, being driving without regard for public safety. If one looks to the right, and behind, one will see an entire shopping mall worth of parking, with an abundance of empty stalls. If desired, you can easily park far away from other cars. There is no reason whatever to park directly in front of product, outside the owner’s dumbassery. They may not want to risk door dings, but here are a couple of realities: 1) if you drive your car in the real world, you have to accept the possibility of real-world damage. 2) If you look on the bottom edges of the fenders and rocker panels, you will see many small chips and dings from the wheels throwing up debris on the road. Every car has them. The car is not flawless.
I was hoping someone would need fertilizer, and ‘accidently’ have one split open on the car.

Imagine my surprise when I flipped on the bedroom light, and saw I had a visitor. Picked it up by the tail, opened the door, and tossed it back into the woods.

We’ve had cars and animals, now a bit of both. A couple of Jaguars in front of my local, recently. Honestly, that’s more class than this place can stand.
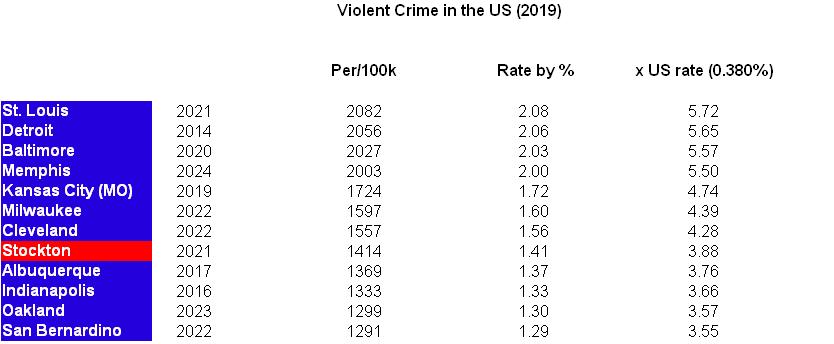

Of the six measurements evaluated, two are city-specific, and not directly comparable to the State metrics. While I ranked the city scores 12 – 1, just as or the States, I did not use that score for the final tally. Because we are looking at States, I noted how many Cities each State had on one of the City lists, and used that incidence number for the score. This prevents a City with a high crime ranking, for instance, from skewing the State result.
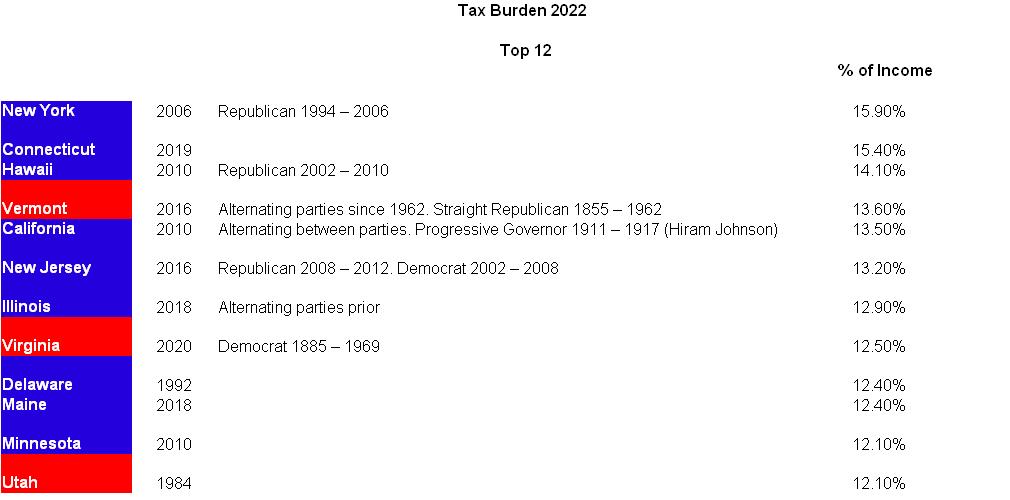
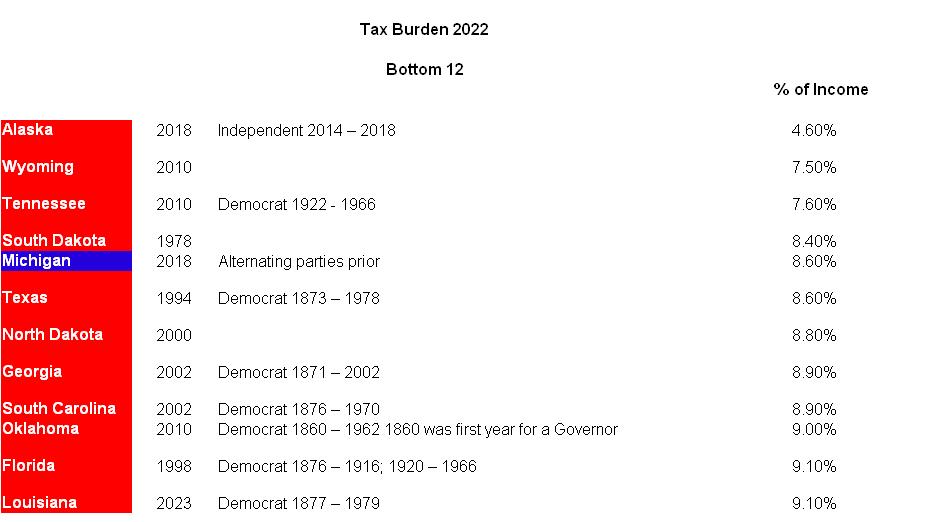
For each metric, States were assigned values 12 – 1, with 12 the top entry, or the worst place on that particular list. The values were summed across categories, and the City scores added as noted. No further data processing was done: the scores are the scores. Based on the metrics and methodology described over the series of posts, and ranked from Not-really-so-bad, to Get-out-now, here are arguably the 12 worst States to live in the United States.
Louisiana
The Pelican State makes the list because it scores very high on people leaving, and because Lake Charles saw a near 7% population decrease 2020 – 2022, putting it on the City list of population decliners. The State population as a whole declined 1.8% over the period, good for third in that category.
Connecticut
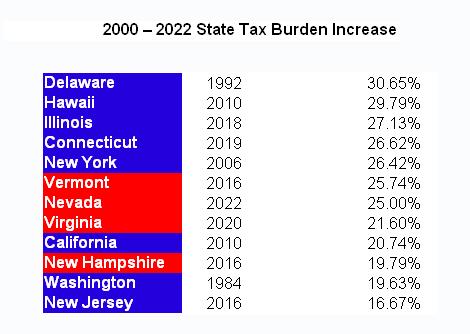
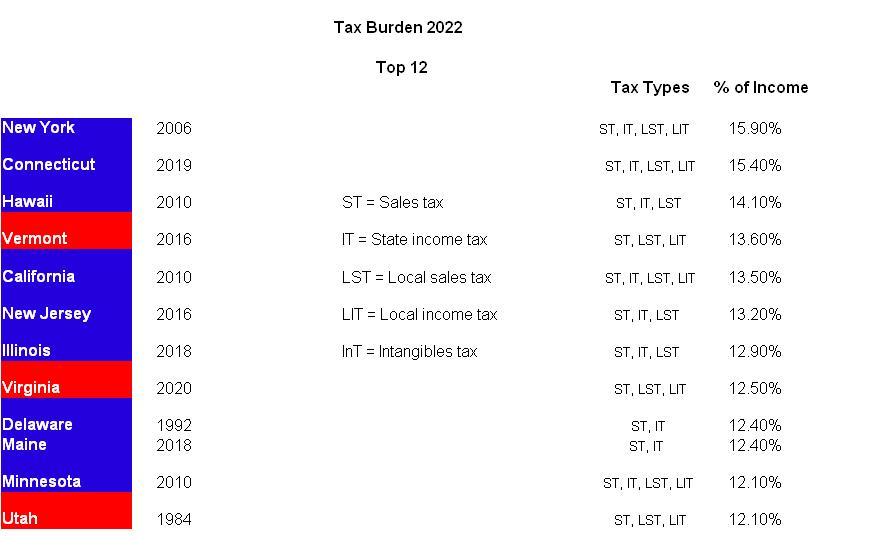
To the surprise of no-one who lives in or around The Nutmeg State, Connecticut is on the list because it has the second-highest State tax burden in the country. The State is also top 12 for cost-of-living. Whatever the attractions of living there, you are going to pay for them.
Colorado
The Rocky Mountains are high, and so is the inflation rate in The Centennial State. Highest in the country, in fact. Colorado did not make the list in any other category, but let prices skyrocket, and you’re sitting at number 10. In fairness, inflation rate is such a transient measure, that if you move to Colorado next year, it will be fine. Probably.
Vermont
The Green Mountain State is in the top 10 for cost-of-living, and ranks #4 on tax burden. That combination lands it at #9. It is a pretty State, but maintaining that scenery costs money, apparently.
Utah
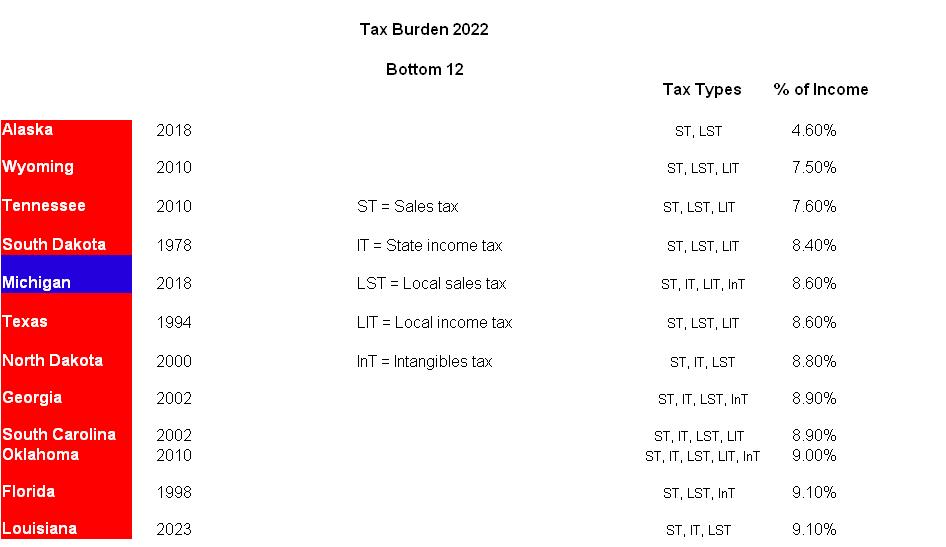
Utah makes the tax burden list, although at the bottom on that list, it’s still a higher burden than 38 other States. There is one city on the population decliners list, but the main reason The Beehive State is on this list, is that it has the second-highest inflation rate among the several States. Again, a transient condition, but those taxes aren’t going away.
Maryland
Maryland ranks around the middle of ne’er-do-wells on the cost-of-living and inflation rate lists, and a city makes the most dangerous cities list, although at the bottom. At #7, The Old Line State marks the first State on the list where crime becomes a factor.
Alaska
If you plan on living in The Last Frontier, bring bags of money. The tax burden is remarkably low, but the cost-of-living and inflation rate are remarkably high. Alaska makes the list at #6 just on those two factors.
Massachusetts
Second-highest cost-of-living in the country, and hemorrhaging people at the State and City level, The Bay State has citizens voting with their feet.
Illinois
From 2020 – 2023, The Land of Lincoln saw 2 people out of every 100 leave for other pastures, good for #2 on that measurement. The State has a medium-high tax burden among the top 12 offenders, which may increase as there are fewer people to pay taxes.
Before we look at the Top 3 Worst States in America, I’d like to point out that the scores for these States were double those of any other State. Remember, in this scenario, high score loses. These States are in a dystopian league of their own. To this point, most States scored in a couple of categories with middling scores, or one category with a high score. These States had high scores across multiple categories. They are the Get-out-now States. And, people are.
New York
The Empire State has well and truly fallen. Number one in population decrease and tax burden, #4 for cost-of-living. The Big Apple itself lost over 5% of its population 2020 – 2022, while the State itself lost a nation-leading 3% of its population. A place where nobody lives, nothing works, and the State has all the money. People used to come to this country, to get away from places like this. Ellis Island has become a monument to irony.
Hawai’i
Hawai’ians have the highest cost-of-living by a margin: over 20% higher than next-highest Massachusetts, but The Aloha State makes up for it with the fourth-highest State tax burden. The inflation rate is high, and that and the other factors may be why the State is on the list of largest population decliners. ‘Aloha’, also means ‘goodbye’.
California
Look up ‘failed state’. Was it a picture of California? The (once) Golden State was the only one to score in all six categories, and not by a little bit. California has become America’s own totalitarian regime. Third-highest cost-of-living, fourth in inflation rate and population decline, and the fifth-highest State tax burden. Five of the fastest-shrinking cities in the country are in California, all of them in the Bay Area. Three of the Top 12 crime-ridden cities are in California, one in the Bay Area. No other State placed more than one city in either category. ‘The Big One’ might actually be an improvement.
Conclusions
The first cut on any analysis is, does it feel right? Do the conclusions jibe with observation? I have seen people defend obviously wrong conclusions because ‘that’s what the math says’. The ‘math’ means nothing, by itself. If the conclusions are at variance with observation, the model is wrong.
The conclusions here feel right, especially the top 5. They are places historically and currently infamous for high costs and governed with a heavy hand. I do not think the same type of analysis with different metrics would yield markedly different results. California would still be the worst place to live in America. You could ask half of Oregon.
Leave a Comment
Posted in Commentary, Lists | Tags: Commentary, Lists, Society